Describe the Reports Available in the Admin Centers
Part of your role as an administrator may be either to drive utilization of Microsoft 365 services or to provide reports or supporting documentation to organizational change management individuals who are responsible for helping end users adopt Microsoft 365 services.
The Microsoft 365 admin center provides reports that can help your team understand what features are being used and highlight potential gaps in your organization’s adoption journey.
Adoption Score
The first reporting feature that you’ll explore is the Adoption Score. Adoption Score offers valuable insights into your organization’s progress on its digital transformation journey, specifically concerning the utilization of Microsoft 365 and the associated technology experiences. This score takes into account various metrics related to both people and technology experiences within your organization and allows for meaningful comparisons with benchmarks established by similar organizations.
To access the Adoption Score dashboard, navigate to the Microsoft 365 admin center (https://admin.microsoft.com), expand Reports, and then select Adoption Score.
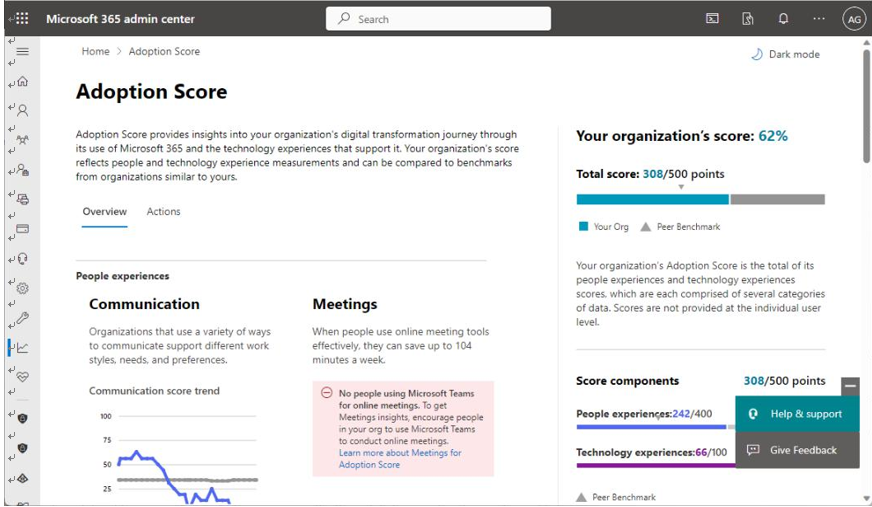
Figure 6.8 – Adoption Score Overview tab
The Adoption Score dashboard features two main tabs: Overview (shown in Figure 6.8) and Actions (shown in Figure 6.9).
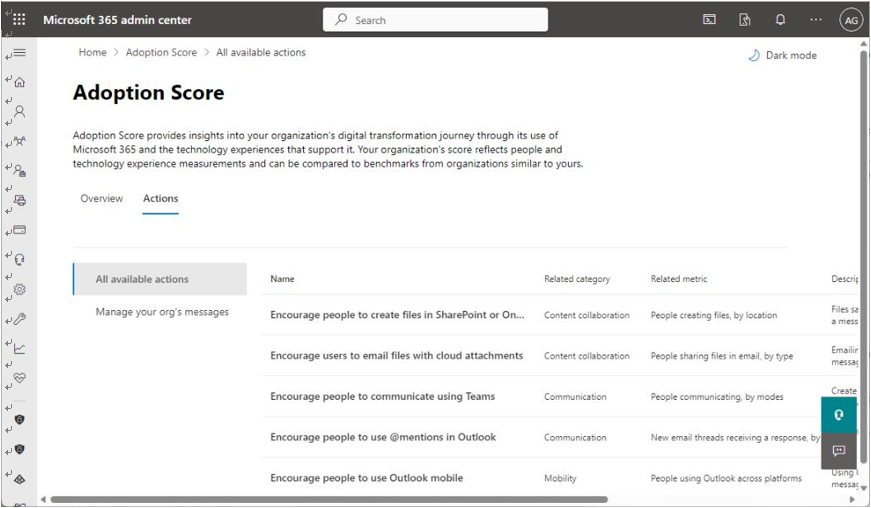
Figure 6.9 – Adoption Score Actions tab
You’ll now explore the features available on the Overview tab.
Overview
The Overview tab is designed to highlight the high-level metrics gathered for your organization.
Each assessment area carries a value, and the aggregate of those values is your overall Adoption Score.
People experiences
The People experiences score is comprised of five benchmark areas:
- Communication: The Communication benchmark tracks how many modes of communication each of the people in the organization is using (email, chat, and community posts), with the idea being that more modes of communication mean that people are comfortable using a variety of tools, based on their preferences and needs, to communicate with others.
- Meetings: The Meetings component tracks how people are using Teams meetings. For example, how many meetings people attended where video or screen sharing was used, how many hours per week people are in meetings, and how long the meetings are.
- Content collaboration: This benchmark tracks how often people are co-authoring documents. Content collaboration improves both the quality of the content being produced and reduces the overall amount of time spent creating content.
- Teamwork: The Teamwork score tracks how shared resources are being used, with metrics such as how many inactive team channels there are, how many group members are in a team versus how many are actively engaged in contributing content or messages to a channel or chat, and how often content is being updated or contributed to on a weekly basis in those shared workspaces.
- Mobility: The Mobility metric tracks how many different devices or platforms people are accessing Microsoft 365 services from (for example, using Teams on a desktop or laptop device as well as using it on a tablet device). A high score means more people are using more modes of access, highlighting flexibility in getting work done.
Each of the five areas is worth 100 points in total—a higher score indicates that your users are getting more out of Microsoft 365.
Technology experiences
The Technology experiences score attempts to capture how well the devices in your organization are supporting your end users’ ability to work. This metric has two areas:
- Endpoint analytics: This benchmark collects the health data from Intune to help determine how healthy and up to date devices are and how well they are performing.
- Network connectivity: Since Microsoft 365 is a cloud-based service, connectivity is a key factor in ensuring the users have a good experience. The Network connectivity score tracks things such as TCP latency, download speed, and UDP connection quality.
Like the People experiences components, each of the Technology experiences components is worth a maximum of 100 points.